Experiment documents for download
This experiment is adapted from the literature (Neppel et al., 2005)
Background
The most common use for titration experiments is to determine the concentration of an analyte. For example, an acid solution of a known concentration can be added to an alkali solution of unknown concentration. The volume of the acid that has been added is recorded when there is an indication that the solution is neutralised. From this, the concentration of the alkali can be calculated. We will go into more detail about how this is done later on.
The end point of the reaction is shown using an indicator. Indicators are molecules that change colour depending on whether they are in acidic or basic conditions.
Some common colour indicators for titration experiments are:
Phenolphthalein
Methyl orange
Despite 1 in 12 men and 1 in 200 women in the UK having colour vision deficiency, titration experiments in schools currently rely on colour change observations.
Experiment
This experiment uses onion as a multi-sensory indicator (displays a change in smell and colour) to assess the titration endpoint.
All instructions and questions for students are available to download at the top of the page and can be edited as appropriate for the VI student/cohort. This can include being translated into braille, being enlarged or implementing a screen reader.
Aim
To work in pairs to determine the NaOH concentration in analyte solutions containing onion indicator by titrating them with 0.1 M HCl.
Safety
A lab coat, goggles and gloves must be worn throughout this experiment.
Teachers/technicians should make the notched syringes and the analyte solutions before pupils start the experiment (instructions are available in the downloads at the top of the page).
You will need:
3 x onion indicator solution
1 x 5 mL notched syringe.
1x 1 mL notched syringe.
1 x 0.5 mL notched syringe.
1 x stirrer bar
1 x stirrer bar magnet
1 x stirrer plate
1 x fan
1 x 200 mL beaker filled with HCl (Ask a teacher to top up this HCl throughout the experiment if you are finding it hard to draw liquid out of the beaker).
Method
Procedure for the student making observations:
- Place one of the beakers containing the analyte solution on the magnetic stirrer plate and put the stirrer bar in the solution.
- Turn the stirrer plate and fan on, sit about a meter away from the solution and check that the airflow of the fan is in line with your nose.
- Observe the changes in smell as your partner transfers HCl into the analyte solution, telling your partner every time the intense smell appears or disappears.
- When the intense smell lingers and does not disappear the reaction is over.
Procedure for the student putting the HCl into the solution:
The value obtained in run three is the total volume of HCl added at the endpoint to the nearest 1 mL.

Questions
Volumes of 0.1 M HCl needed to neutralise 10 mL of NaOH analyte solution:
Run 1:
Run 2:
Run 3:
-
- Using your result from run 3, work out the concentration of NaOH in the analyte solution.
-
- What were your observations at the end point?
-
- The actual concentration of NaOH is 0.2 M, what do your results tell you about the indicators being used?
Answer to question 3 – discussion about the accuracy of the experiment (extension work):
Students should not worry if they don’t understand all the details of this explanation as it is beyond the scope of the course.
At the equivalence point in a titration there is a sudden drop in pH:
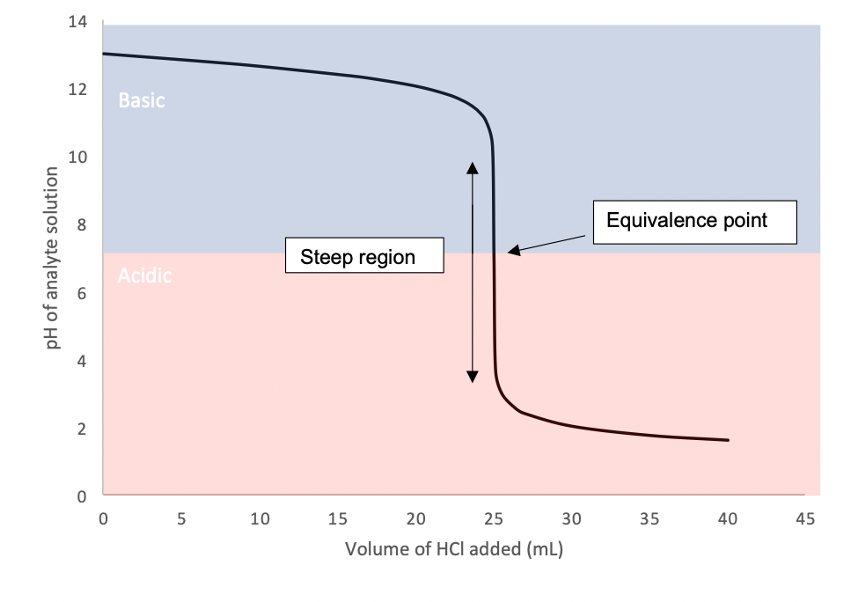
In order for the solution to be neutral there must be an equal number of moles of NaOH and HCl. Assuming we are titrating 0.1 M HCl into 10 mL 0.2 M NaOH, the steep region of the graph should occur when 20 mL of HCl has been added (as seen when phenolphthalein is the indicator):
However, this is not what we observed when the olfactory indicators were in solution!
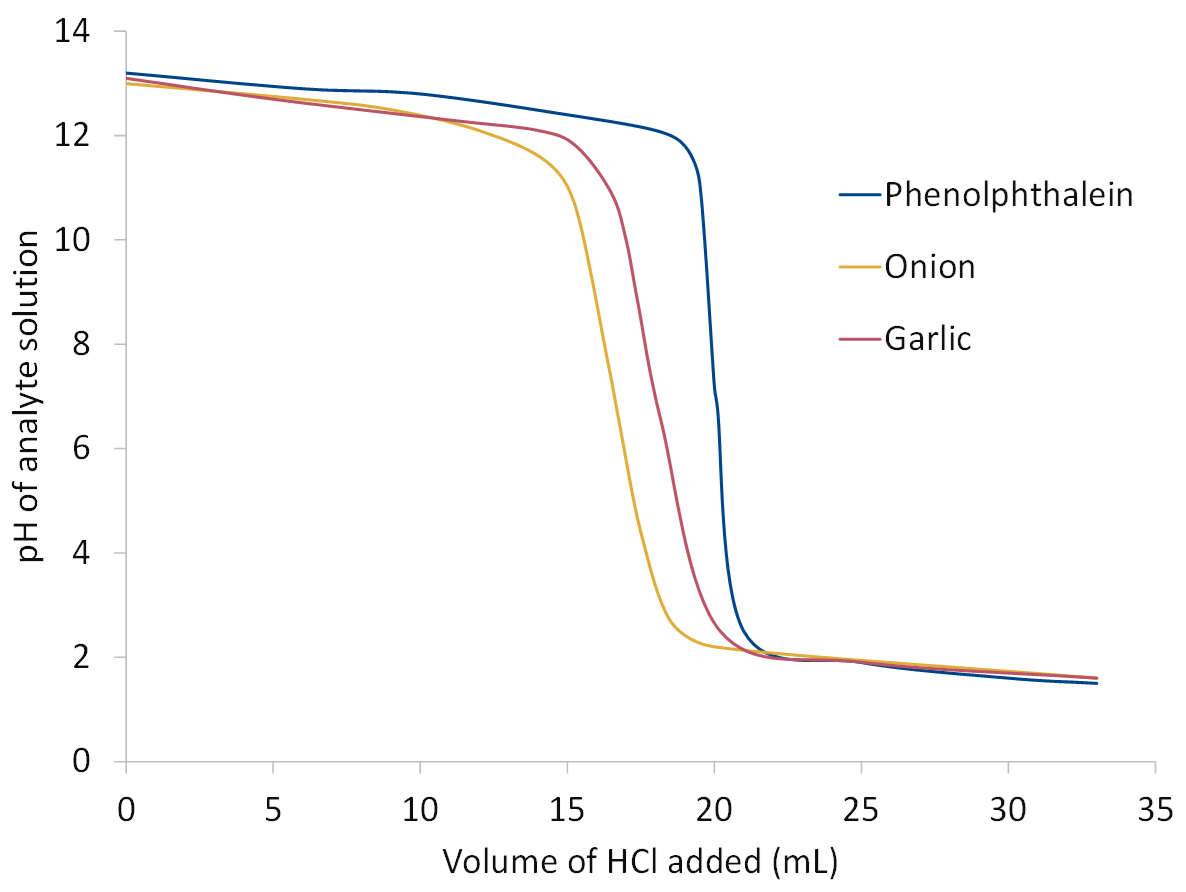
The raw data for this graph can be downloaded here.
The fact that we need less acid than expected to neutralise the NaOH solution must mean that the onion/garlic indicators are significantly acidic, making the analyte solution less alkali than we thought!
This means that they cannot be used to produce accurate concentration values but are a good way for students with and without vision impairment to learn about titrations.
Page author: Rachel Chataway-Green
