Background

Chromatography is a laboratory technique used to separate out and identify the individual components inside of a mixture. There are multiple different types of chromatography, such as: Liquid Chromatography (LC) and High-Performance Liquid Chromatography (HPLC), Gas Chromatography (GC), Thin-Layer Chromatography (TLC), Size Exclusion Chromatography (SEC) and Paper Chromatography.
On this page, we will focus on conducting a Liquid Chromatography experiment – in our case, inside of a biro pen. This is a vital technique that separates out components within a dissolved mixture. The liquid sample will pass through the column which will contain both the stationary phase and the mobile phase. Colours will split up inside the column depending on how polar each component is. For example, if you use water as the mobile phase – which is highly polar – all the components that are also highly polar will travel down the column with the water. Anything that is non-polar will stay in the column, because it will attach itself to the stationary phase more.
Interactions with the Stationary and Mobile Phases
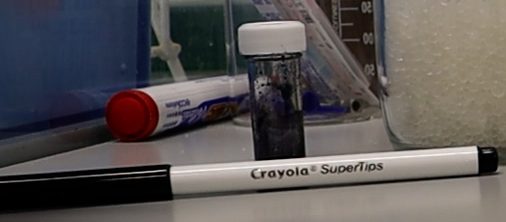
LC involves a stationary and mobile phase, as well as your sample. Your sample (also called the analyte) will be a solution of ink to water in the ratio 1: 200. We have extracted the ink from a black Crayola pen, and using a pipette we took 1 drop of the concentrated ink and mixed it with 5ml of water in a vial (so that this mixture is 1:100). From this mixture, we extracted 2.5ml and then added 2.5ml of more water to form the 1: 200 ratio.
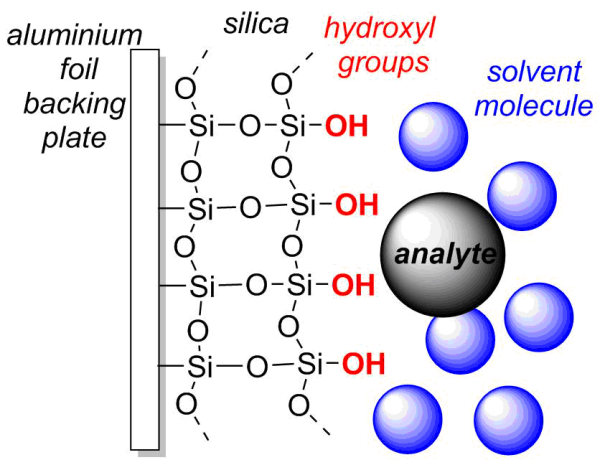
The stationary phase is our cracked silica beads (cracked by placing them in water). By cracking the beads this increases the surface area and allows us to fit them into the biro column. Silica is much less polar / hydrophilic compared to water, since water is highly polar. Any colours inside the ink that are less polar will “stick” to the stationary phase more, since like dissolves like (this is based on the fact that less polar sample molecules prefer the phase with similar weak Van der Waals forces). We found that silica beads alone works better than either sand or sand mixed with silica beads – the sand made it very difficult to see the colours running through the column, and made the flow rate too slow.
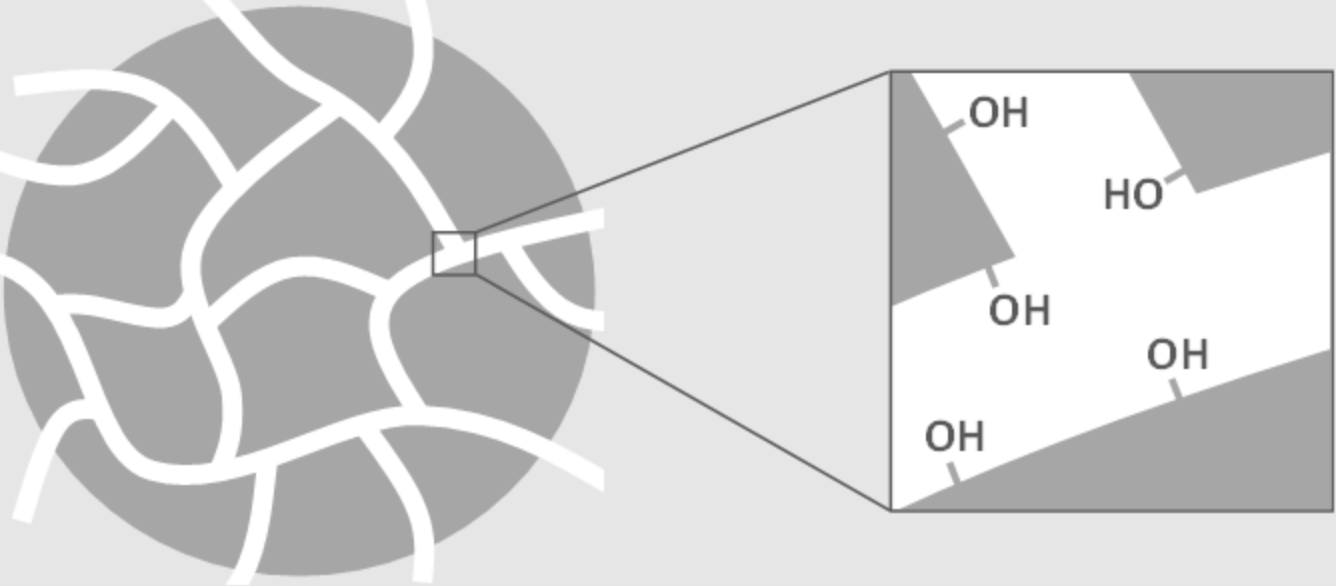
Silica can be found in sand on the beach, however the silica that we use in columns a slightly different.It has lots of holes in it, called pores. The surface of all those holes is covered in Si-OH groups. We call these silanol groups. The holes give the silica a really high surface area. This means lots of space for molecules to stick to!

The mobile phase is the water that was flowing through the biro pen column, allowing the ink to run through. Water is highly polar, and will therefore attract any substances in the ink solution that are more hydrophilic. You can then follow up with a solvent that is less polar than the silica (once all the hydrophilic colours are extracted out) to elute out the remaining colours. You could use: isopropanol (we have used this in our video above), acetone, ethanol or methanol. You can easily get hold of 70% isopropanol since this is also known as rubbing alcohol. We have used 70% isopropanol since it is both more accessible and much safer to use compared to ethanol (highly flammable) and methanol (extremely dangerous to inhale or have prolonged skin contact with).
The experiment
AIM
To observe the elution of a solution of ink and water through a column containing silica beads and water, and to collect distinct eluates of different colours.
YOU WILL NEED
- A beaker of water
- Multiple pipettes
- A vial of concentrated Crayola ink
- A ‘niceday SMB 1.0 medium’ biro pen (other biro pens can be used, but flow rate using different amounts of cotton wool may have to be adjusted to enable proper seperation)
- Cotton wool
- Scales – specific to 0.01g
- Silica desiccant beads with a spatula that are dry (not ones with a colour indicator and explanation about how to dry is below)
- Multiple empty vials
- Clear tape
- Any white object to attach column to (for white background)
- (Optional to be able to elute the remaining ‘blue ink’) 70% isopropanol (rubbing alcohol)
PROCEDURE
- Make up your solution of 1: 200 , ink : water
- Extracted the ink from a black Crayola pen by snapping the pen, removing the central sponge and squeezing the ink out into a vial.
- Using a pipette we took 1 drop of the concentrated ink and mixed it with 5ml of water in a vial (so that this mixture is 1:100).
- From this mixture, we extracted 2.5ml and then added 2.5ml of more water to form the 1: 200 ratio.
- We found that if the ink is too concentrated, the sample runs through the whole column in a single black band, and does not separate. Additionally, if the sample is too dilute, it is difficult to see the colours and therefore hard to know when to swap the collecting vials at the bottom of the column. 1: 200 is the best ratio of ink to water that we found for our method.
- Next, pour some water into a beaker and then carefully pour enough silica beads into the water to fill the inside of the biro pen. Allow all the beads to fully crack – you should be able to hear the cracking!
- To enable the best cracking the Silica beads need to be as dry as possible. New beads should be dry, however if they are a little old we would recommend drying them in the oven at 120°C for 2 hours. To ensure even drying, the beads can be placed on a tray in a single layer and shook every 30 minutes.
- Once this is prepared, you can now weigh some cotton wool out on some scales.
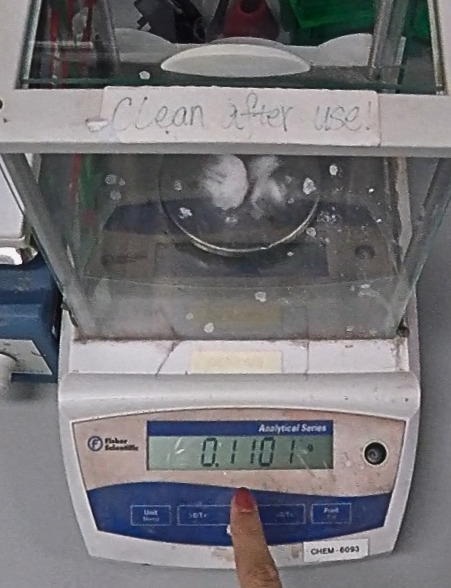
- IMPORTANT: make sure your scales are specific to 0.01g so that you can weigh exactly 0.11g of cotton. This should be exact, since we have found through multiple trials using different measures of cotton that this has a big impact on your drop-rate. If the drop-rate is too fast, this causes poor resolution; if the drop-rate is too slow, this causes band-broadening and blurred fractions. Therefore, this should be kept consistent.

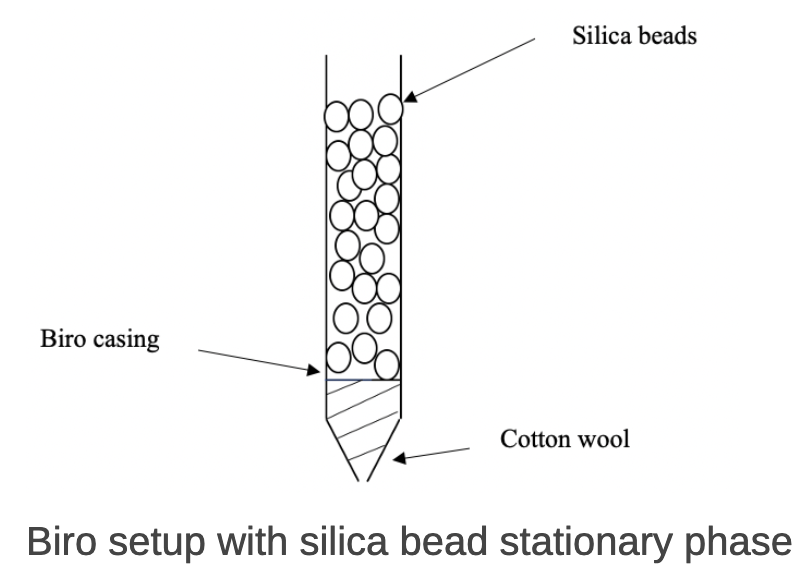
- Take apart a biro pen – keep the ink cartridge and plastic biro casing.
- Pack the cotton wool into the plastic casing using the ink cartridge to push in down to the bottom of the pen. Pack it to the point that the cotton is 25mm / 2.5cm in length.
- IMPORTANT: again, this will affect the drop-rate of the water running through, therefore ensure that this is exact.
- Using a pipette, put some water inside of the column (plastic biro casing with the cotton inside) and allow the water to fully seep through the cotton for about a minute. Then fill up to about 3/4 of the way up with the water, and time how long it takes for the water to drop through. It should be somewhere between 6 and 7 seconds.
- *How much water you put inside the column will affect how fast the water drips through*
- Now you can tape your column to a white object, with enough space underneath for an empty collecting vial.
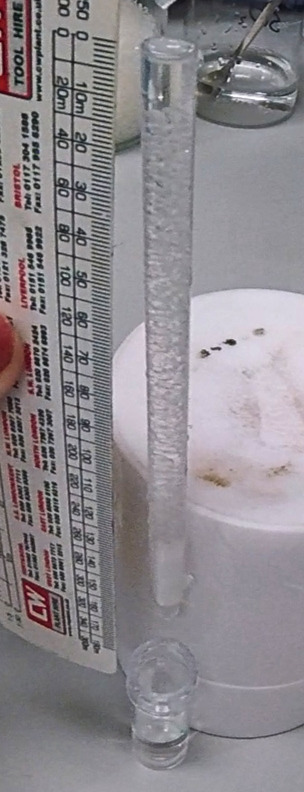
- IMPORTANT: make sure from this point in the experiment you constantly keep the column filled to the top with water – this is so the silica is always submerged in water. If the silica beads are not topped up with water, air bubbles will form – this ruins separation efficiency and reproducibility.
- Pour the cracked silica desiccant beads into the top of the column using a spatula, and keep topping up with water. Give the column a gentle flick / tap a few times to allow the beads to sink slightly to the bottom of the column, and top it back up with beads – allow a 1cm gap of water between the beads and the top of the column.
At this stage, you have to act fairly quickly so that the silica beads do not become exposed to air for too long: Allow the water to fall down to the point where the beads are, and quickly add 3 drops of the 1: 200 solution of ink to water directly onto the very top of the silica beads, and IMMEDIATELY add the water back up to the top of the column.
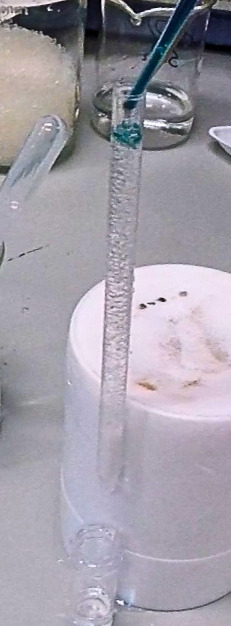
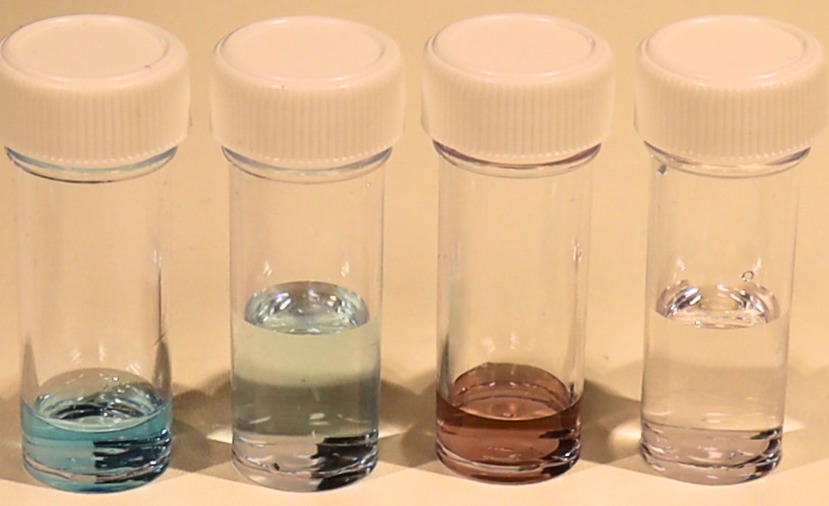
While keeping it topped up with water, watch the colours start to separate out. You can now get some empty vials ready to start collecting your fractions as soon as they start dripping out.
Once all the red has ran through, you can now start adding the 70% isopropanol to the top instead of the water. This should push the blue colour through the column much easier – make sure to swap the vial just before you see the brighter blue to start dripping off (this is so you switch between the fraction of blue eluted off with water and the fraction eluted off with the isopropanol).
Once all the colour has ran through, then the experiment is complete.
Questions
- Which colour elutes first and why might this be?
- Was it possible to remove all the dyes from the column? Why do you think this is? Does this change when you begin using a different solvent and why?
- In chemistry, we normally use organic solvents for column chromatography. What might be some problems with this?
- What might be some challenges with large scale chromatography in industry?
Going further – analysing the eluted fractions
After collecting these fractions, we can analyse the different colour absorptions in each of the solutions using UV-Vis absorbance spectroscopy. Strangely, we could not find any peaks in the blue eluted sample with the 70% isopropanol but thought this could be due to some from of charge transfer in the colour dyes. This occurs when electrons that absorb light at a specific wavelength transfer between orbitals on a ligand or on a metal before emitting the light. As the specific dyes Crayola uses is protected under copy-write, we do not know the specific compounds making the blue colour.
However, we were able to see some peaks in the red fraction eluted. This can be compared to the UV-vis spectra of the diluted samples below. It can clearly be shown how many of the dyes were still in the red as it is reflected by peaks at the same wavelength. However, as we can see a different colour, the compositions of these dyes must have changed.
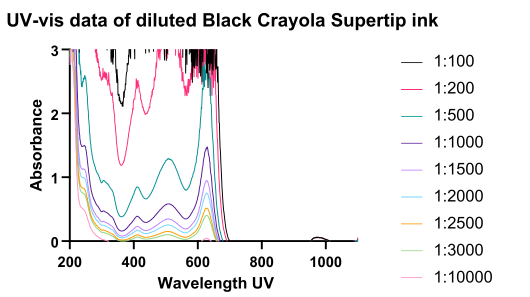
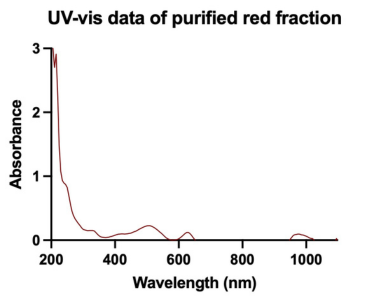
Graphs containing showing the data from the UV-Vis absorbance spectroscopy of the diluted black ink (left) and the collected “red” ink (right).
In the research lab
At the University of Birmingham, in the department of chemistry the most common from of completing column chromatography in the research is where you pack silica gel in a column. Silica gel in powder form can cause eye, skin, or lung irritation from the dust, however it works in a very similar way to our cracked silica beads. It is more efficient than our chromatography system as the fine powder enables both a higher surface area and a more uniform flow down through the column. This specific example is provided by Harry Houlton who is a part of Dr Sarah Pike’s Lab where they use it to separate colourful azobenzene compounds.
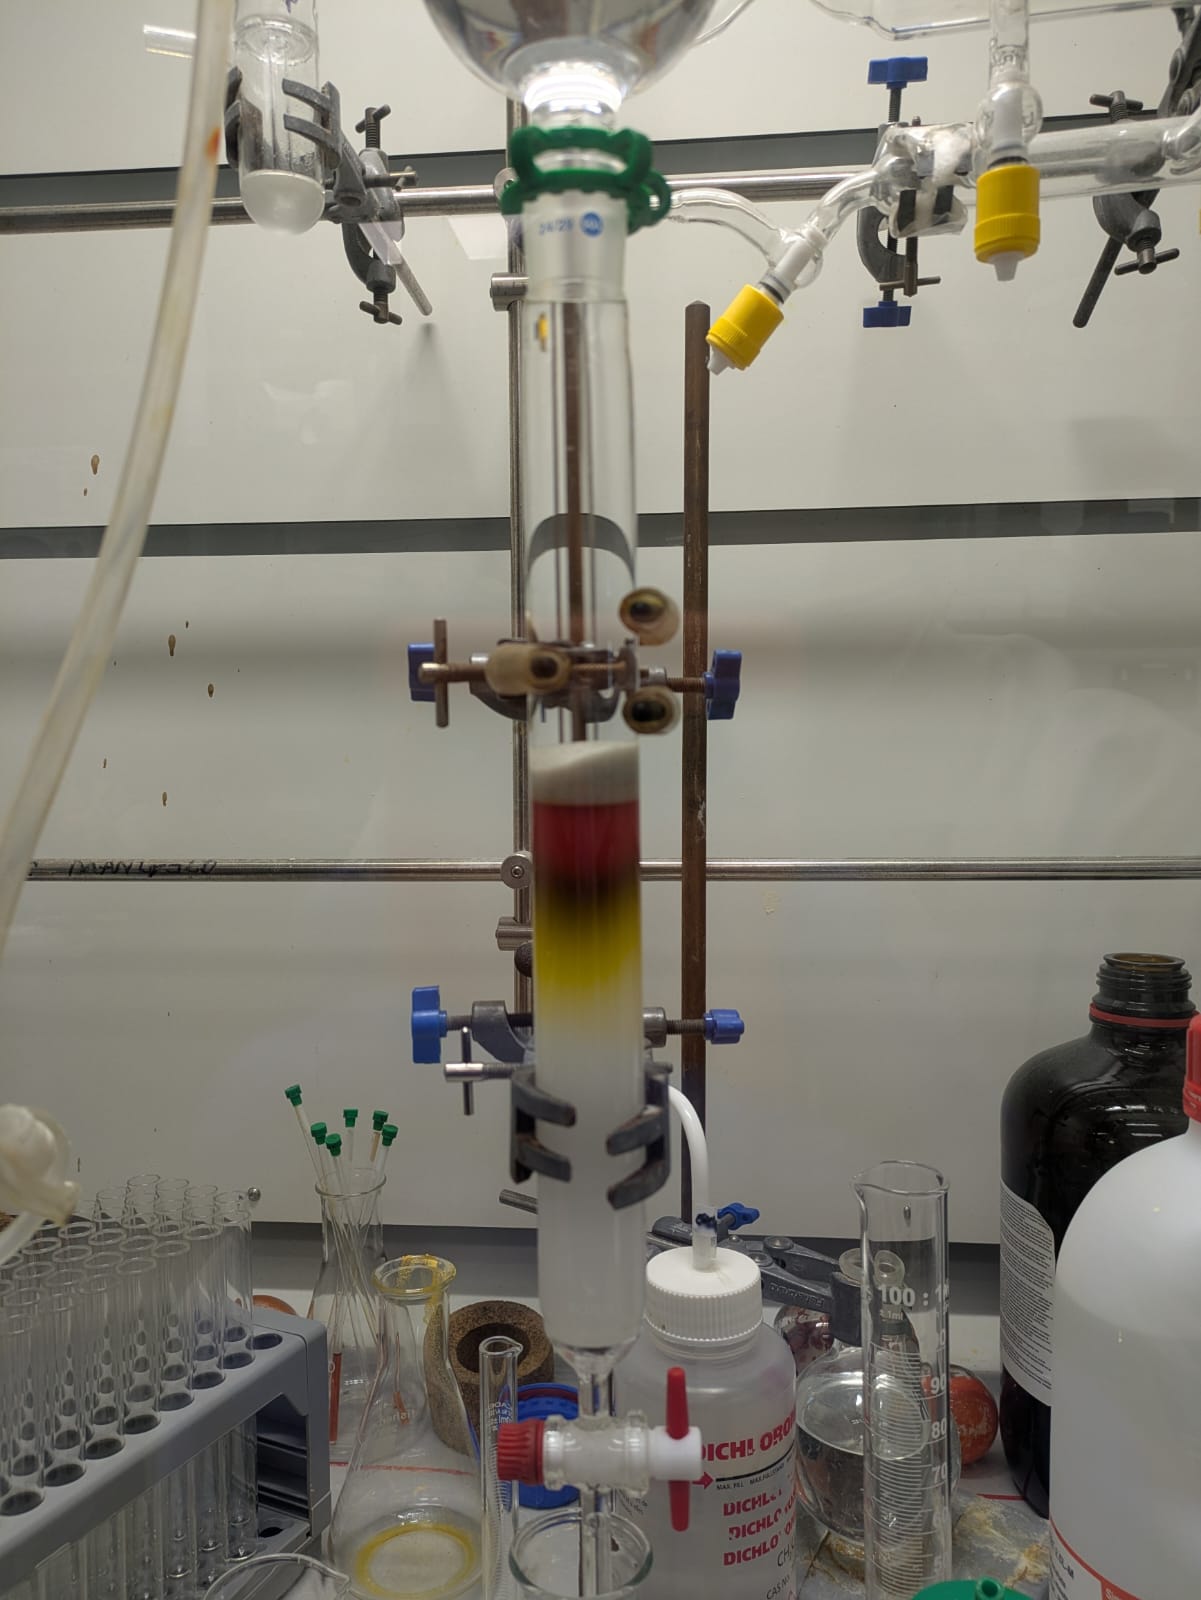
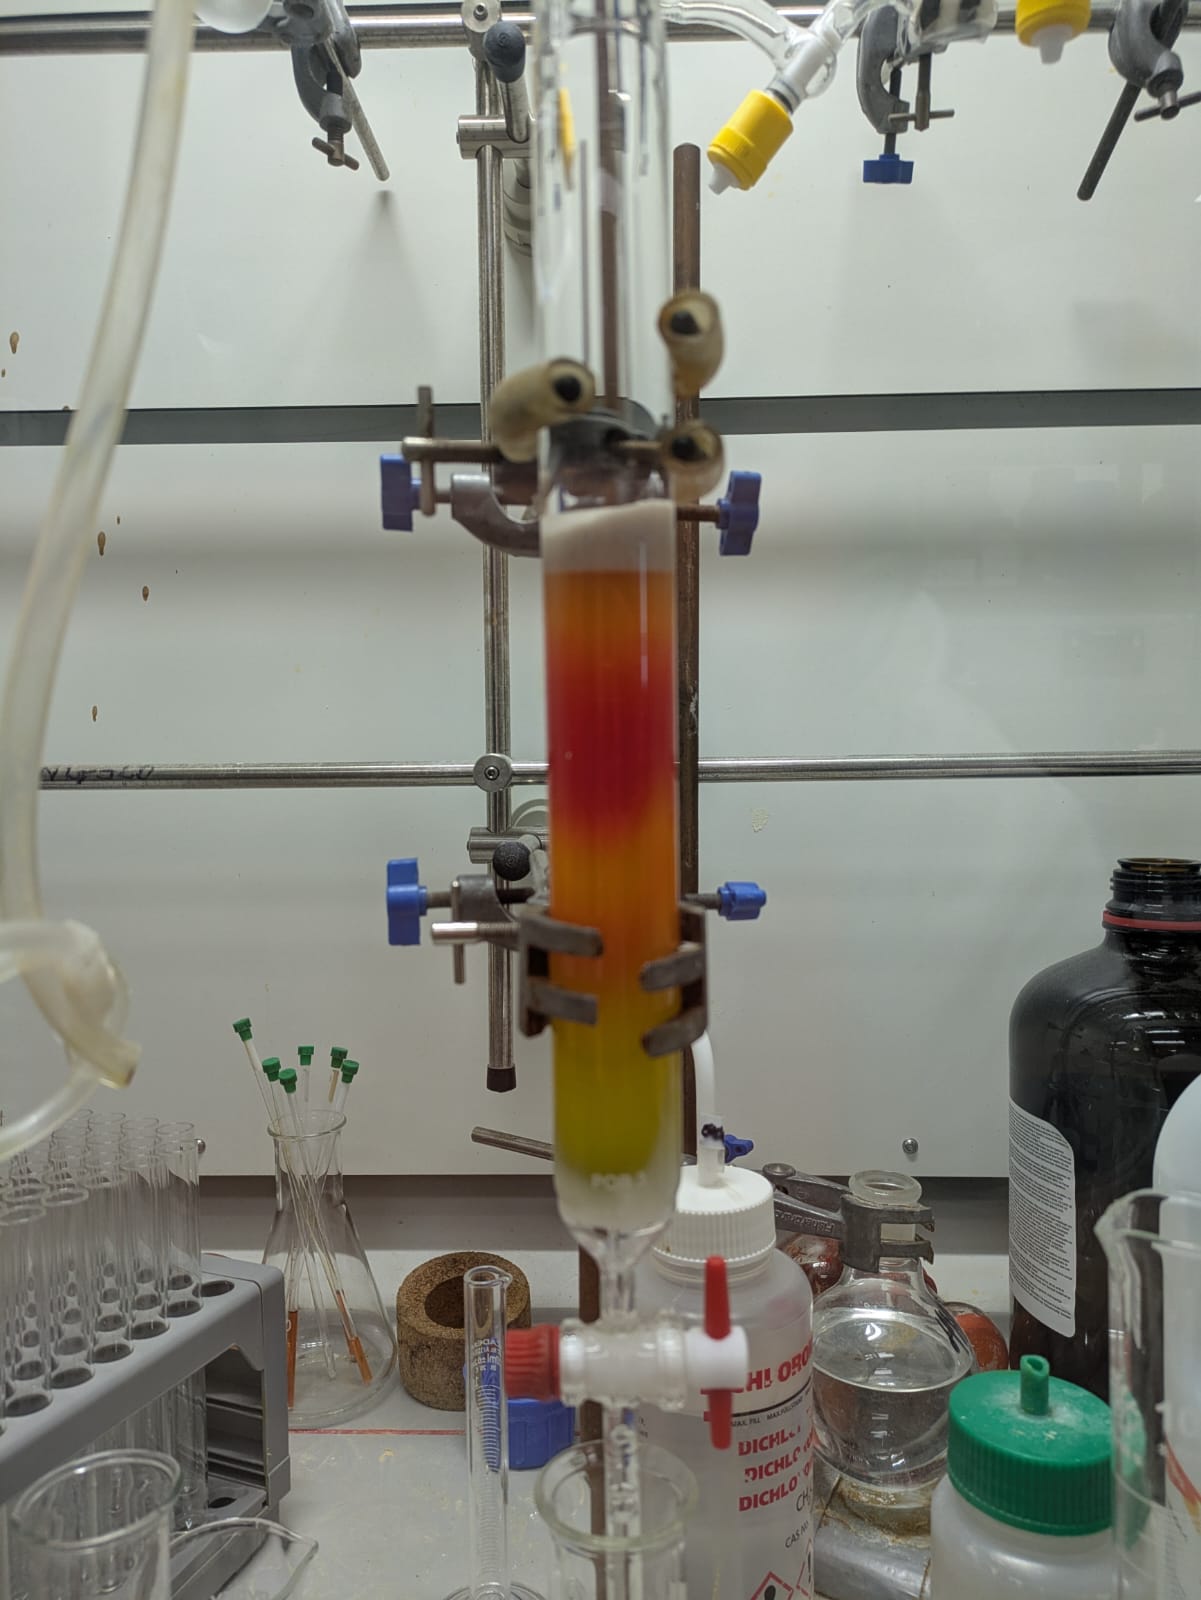
Images showing silica gel column chromatography to separate colourful azobenzene compounds in the Pike lab.
This can also be completed using a machine automatically dispenses fractions out into vials. The column and collected fractions look like this:
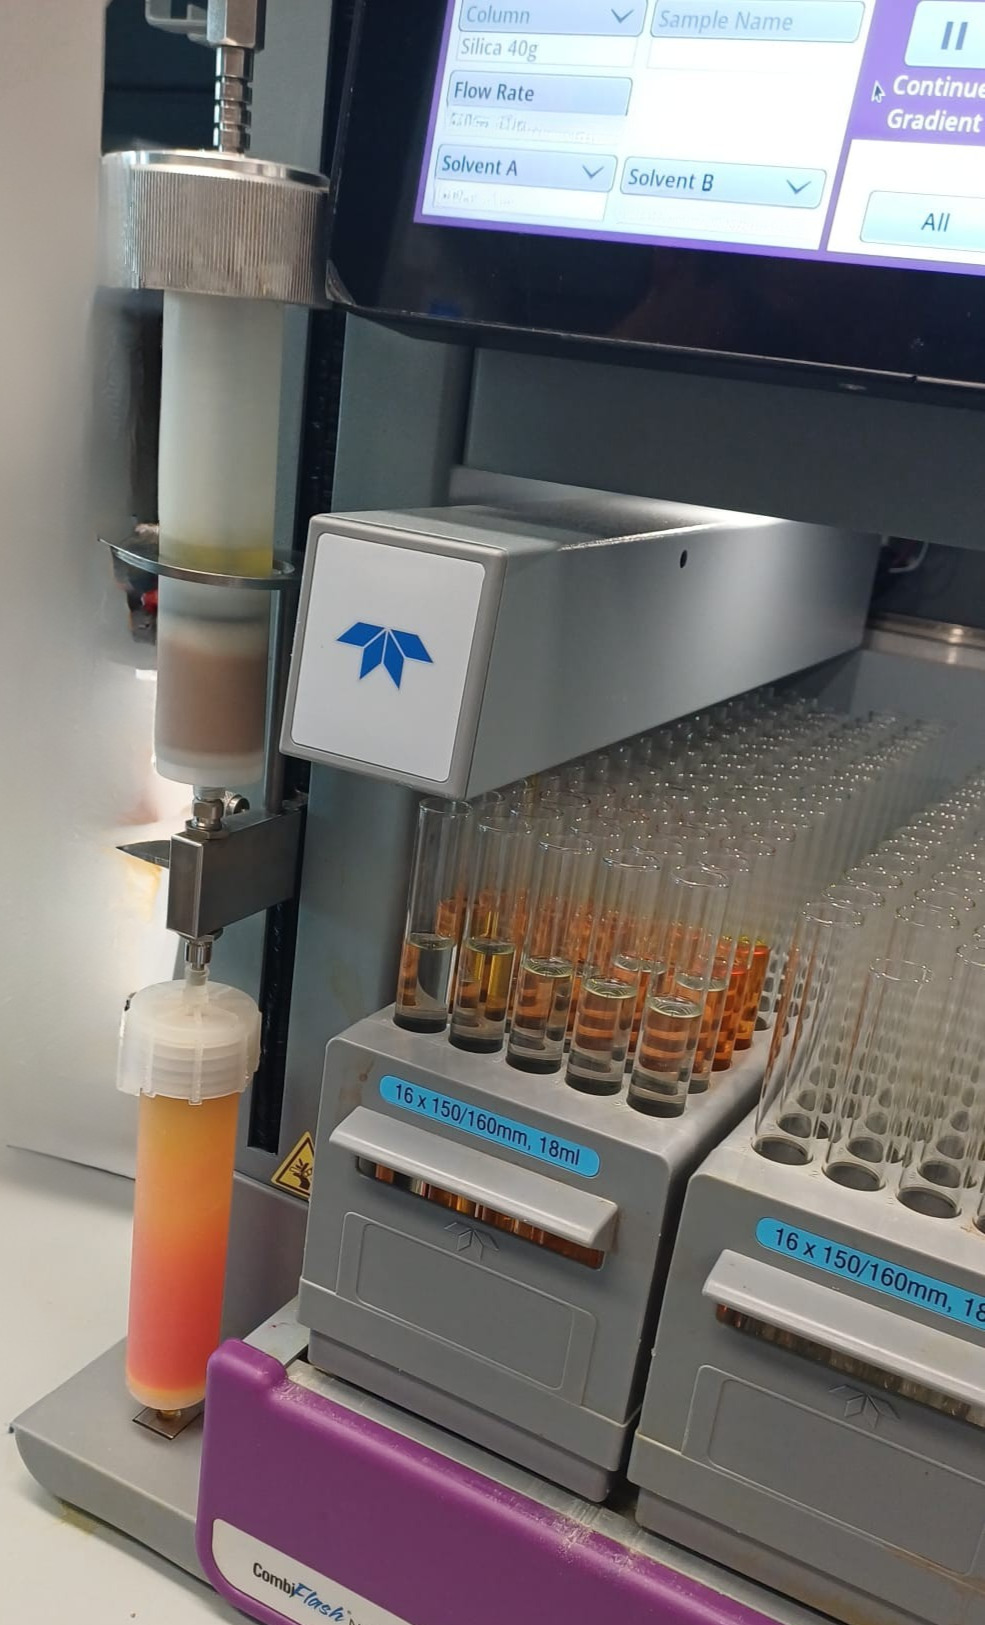
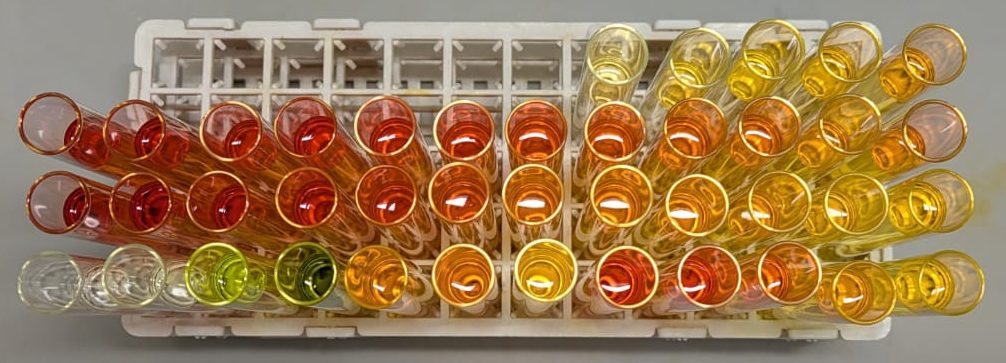
Images of the automatic liquid chromatography set up used by the Pike Lab. The first image shows the machine, the second image shows some collected fractions (from a different run)
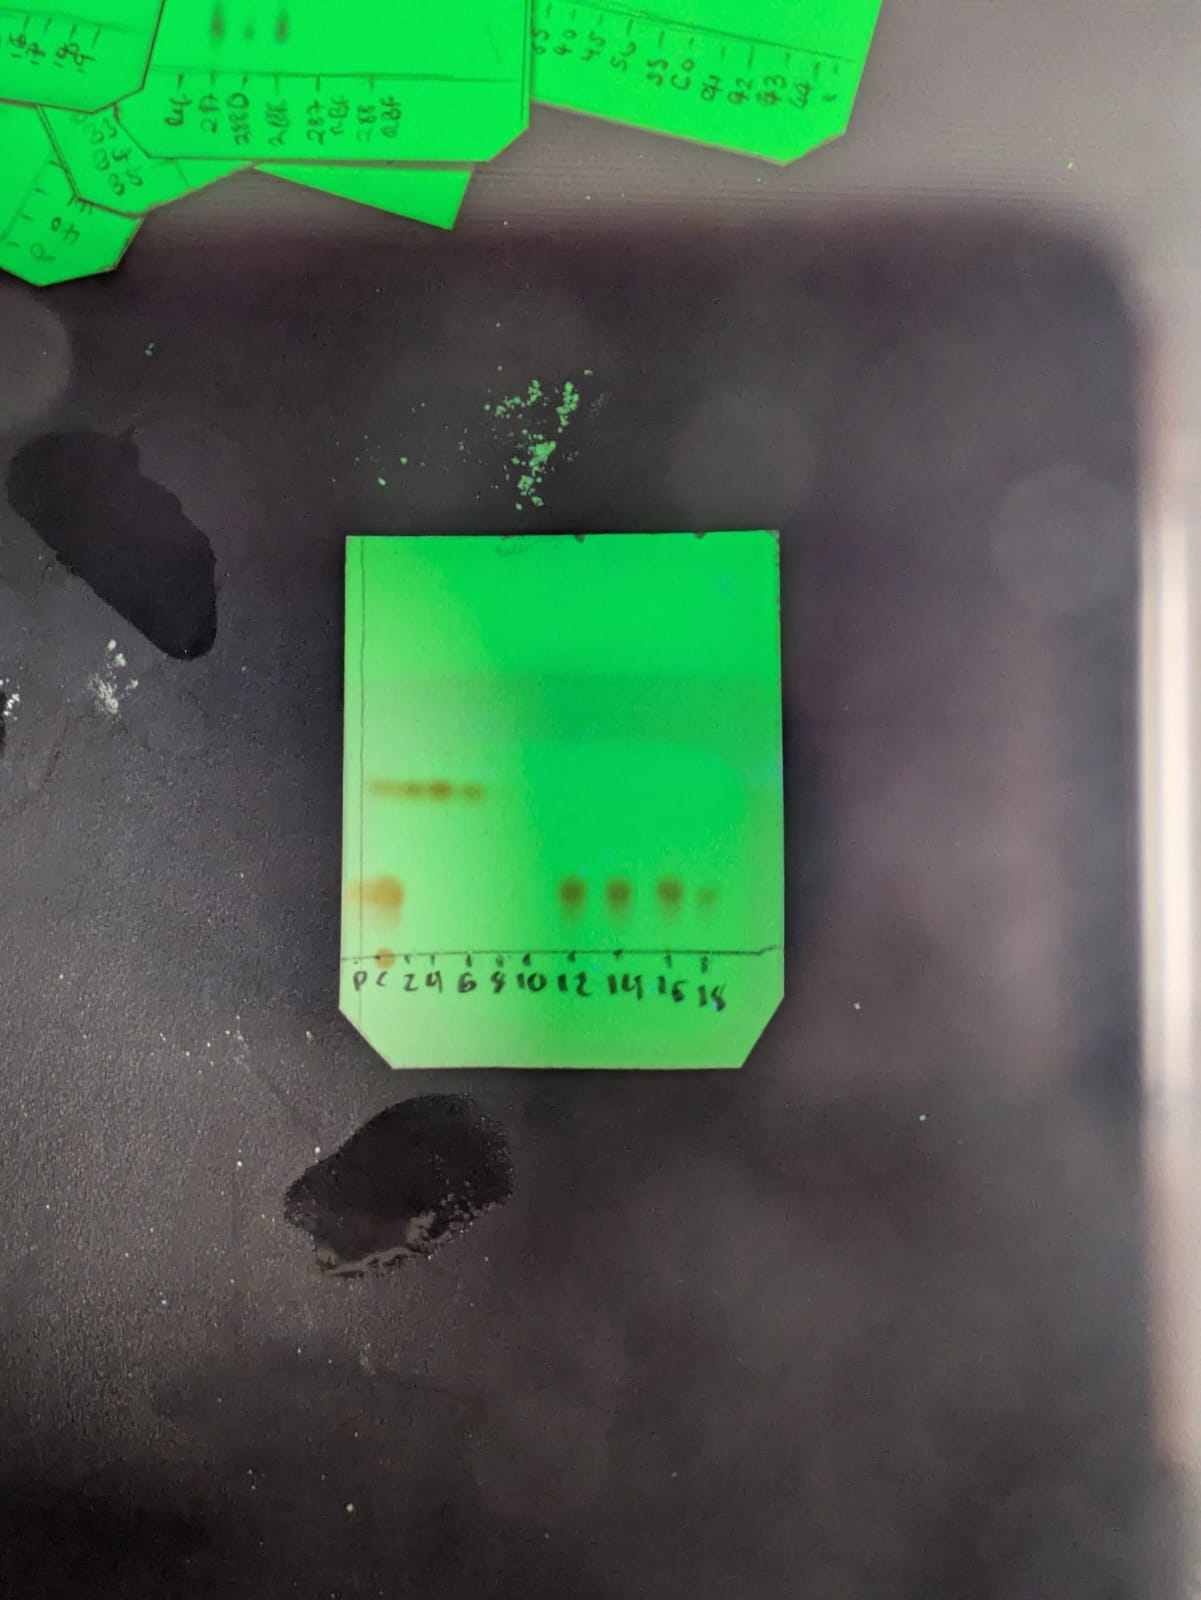
Before you would set up the chromatography column, you would run a TLC. This is to find the ideal solvent system, confirm separation between desired products and by-products/impurities, and identify the product spot. The TLC attached to the right (kindly provided by the Pike Lab) shows the compounds coming off. The first spot on the left is the pure product; Second is the crude reaction mix with two spots in it. Then the next compound comes up (green, moves further up the plate), then the product comes off (right hand side spots).
Another form of Liquid Chromatography is High-Performance Liquid Chromatography, also known as HPLC. This is similar to the experiment above, however with HPLC this uses high-pressure pumps to force the liquid through extremely confined spaces (smaller particles in the stationary phase). HPLC is used for analyses in pharmaceuticals, food testing and environmental monitoring.
Find out more
To learn more about how silica columns were used in Dr Sarah Pike Lab’s research you can check out the paper below. (Click the Image)

Page credits
Page created by: Chloe Haynes
Supervised by: Molly Jefferies
In the research lab example and photos kindly provided by: Harry Houlton
Using material and resources from a previous page created by: Rachel Chataway-Green
Most recent update: 07/07/2026

This work is licensed under a Creative Commons Attribution 4.0 International License.

