
Size exclusion chromatography (SEC) is a method where separation of different compounds occurs according to their size (hydrodynamic volume) measured by how efficiently they penetrate the pores of the stationary phase. It is usually applied to large molecules or macromolecular complexes such as proteins and industrial polymers. There are two basic types of size exclusion chromatography. One is gel permeation chromatography (GPC), which uses a hydrophobic column packing material and a non-aqueous mobile phase (organic solvent) to measure the molecular weight distribution of synthetic polymers. The other is gel filtration chromatography (GFC), which uses a hydrophilic packing material and an aqueous mobile phase to separate and measure the molecular weight distribution of molecules soluble in water, such as polysaccharides and proteins.
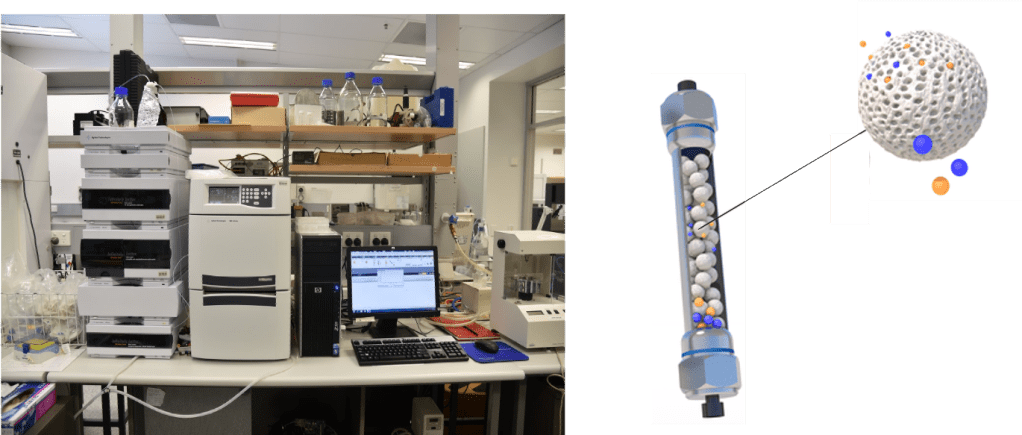
SEC works by trapping smaller molecules in the pores of the adsorbent (“stationary phase”). This process is usually performed within a column, which typically consists of a hollow tube tightly packed with micron-scale polymer beads containing pores of different sizes. The column used is filled with beads containing many pores (Fig. 1). The pore sizes of these beads are used to estimate the dimensions of macromolecules.
When dissolved molecules of various sizes flow into the column, smaller dissolved molecules flow more slowly through the column because they penetrate deep into the pores, whereas
large dissolved molecules flow quickly through the column because they do not enter the pores. Consequently, larger molecules elute from the column sooner and smaller molecules later, which effectively sorts the molecules by size. This is the separation principle of size exclusion chromatography (Fig. 2).
Fig. 2. Cartoon illustrating the theory behind SEC.
One requirement for SEC is that the analyte does not interact with the surface of the stationary phases, with differences in elution time between analytes ideally being based solely on the solute volume the analytes can enter, rather than chemical or electrostatic interactions with the stationary phases. Provided that all the particles are loaded simultaneously or near-simultaneously, particles of the same size should elute together.
In real-life situations, particles in solution do not have a fixed size, resulting in the probability that a particle that would otherwise be hampered by a pore passing right by it. Also, the stationary-phase particles are not ideally defined; both particles and pores may vary in size. Elution curves, therefore, resemble Gaussian distributions (Fig. 2).
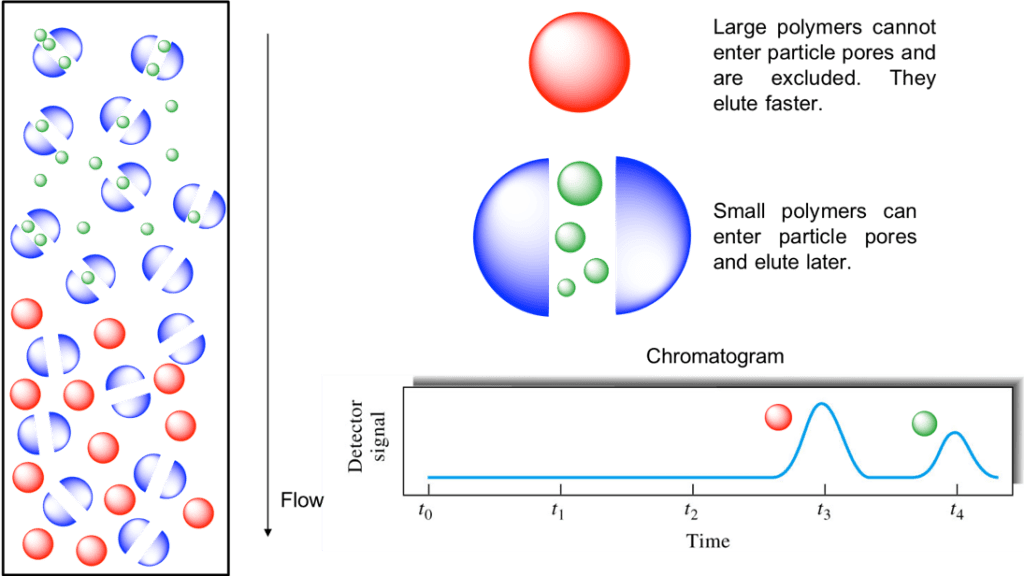
Fig. 2. Cartoon illustrating the theory behind SEC
The following equation generally describes the relationship between the elution volume (Ve) and molecular weight (M) of polymers.
log M = b – c Ve (where b and c are constants)
A graph of this relationship is called a calibration curve. Calibration curves are prepared by using molecular weight markers with known weights to find the elution volume and plotting the logarithm of the molecular weight on the vertical axis versus the elution volume on the horizontal axis (retention time).
SEC can be used as a measure of both the Mw, the weight-average molar mass, and Mn, the number-average molar mass of a polymer. Together with size, SEC can also be used to calculate the polymer polydispersity. This can be calculated using the equation ĐM = Mw/Mn. For synthetic polymers, the lower the dispersity (ĐM value close to 1), the better the polymer quality.
